An data exploration on the Kaggle Titanic dataset
In this notebook, we sink into Kaggle’s Titanic dataset (pun intended) in order to get an understanding of the demographics of the passengers on board. All aboard!

Time Series Analysis on Global Temperatures
In this project for my time series class, I perform time series analysis on a public data set containing the average global temperatures spanning from 1880 to 1985. I build a time series model to forecast future global temperatures and validate using a series of tests. Check it out!

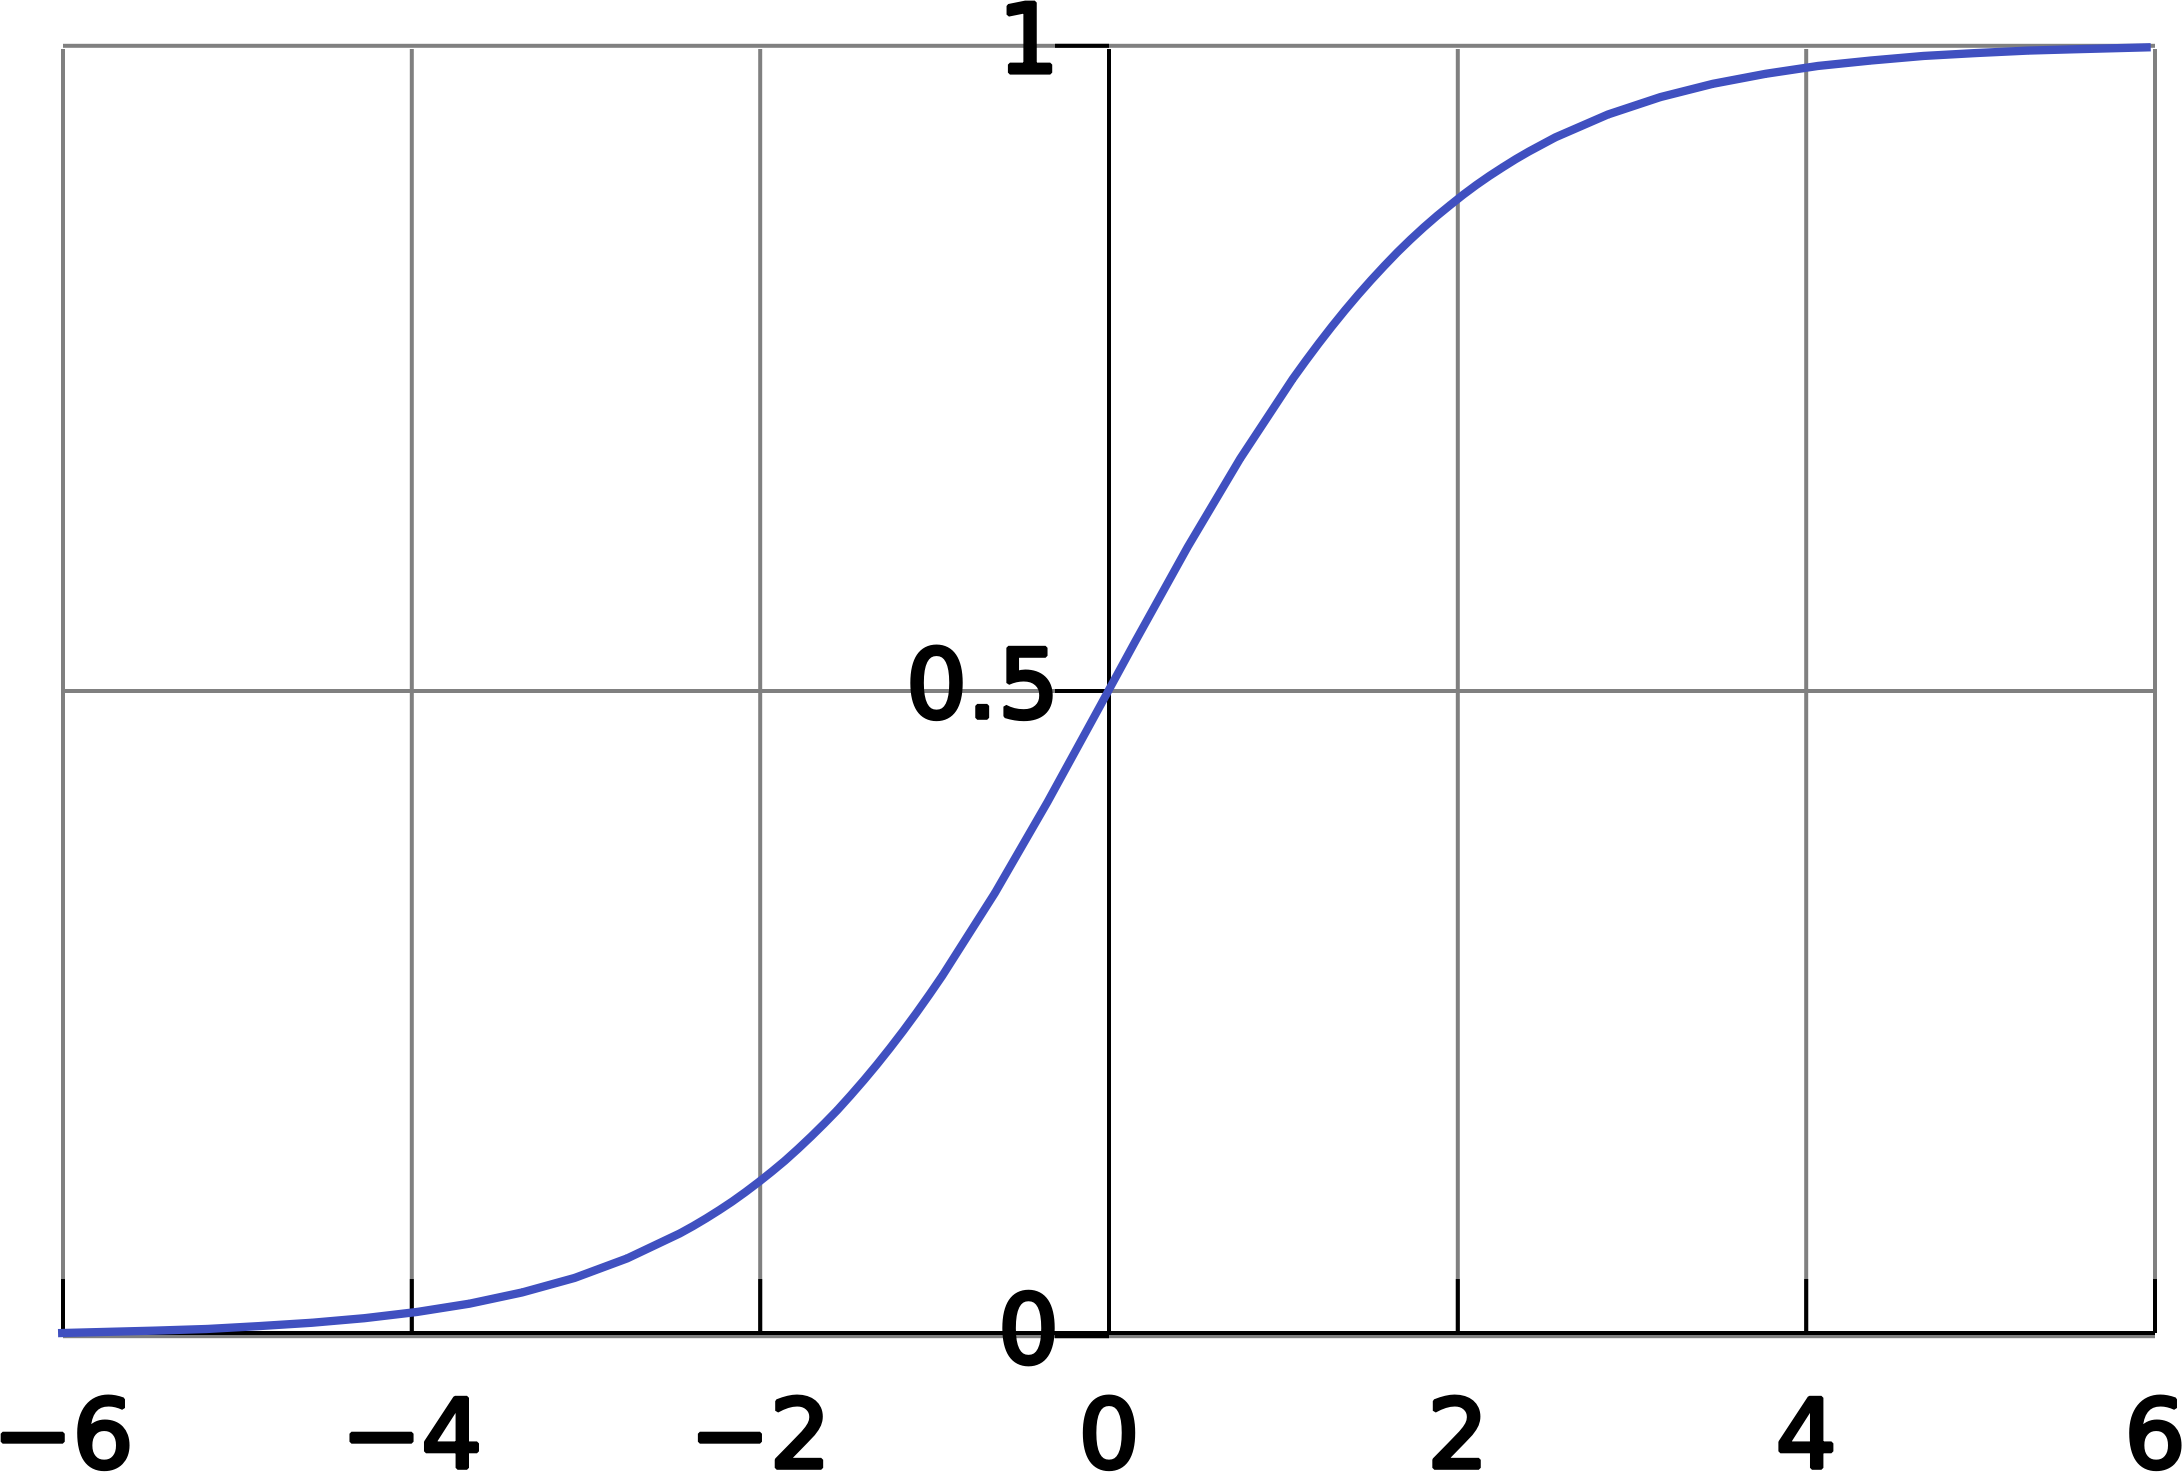
Machine Learning with Scikit-Learn - Logistic Regression
In this project, we take the familiar Titanic dataset and apply a Logistic regression model in order to predict who survived. This will be a series of notebooks in which I try different classification algorithims to see which one best fits the data. See how well it performs here!
Predicting Automobile MPG's with the Cash for Clunkers Data Set
In this project, I use R to to analyze the Cash for Clunkers data set to see what factors affect a specific automobile’s fuel efficiency. I then use that analysis to build a model to see if I can predict the MPG of the cars in the dataset. See it here!

Machine Learning with R - Conditional Forest Algorithm vs Extreme Gradient Boosting
In these two R scripts, I apply a conditional forest model along with an extreme boosting model onto our Titanic data set to see how well it they do in comparison to our first model: the logistic regression model built with SciKit-Learn. Conditional Forest Model VS. XGBoost

Orange and Black - A Data Visualization of the San Francisco Giants through the years
In this notebook, we use Python, Plotly, and Pandas along with SQLite to visualize the performance of my favorite baseball team: The San Francisco Giants through each year that they have been in the city. Join along!

The Moneyball Tactic - The rise of sabermetrics with the Oakland A's
In this notebook, we dive into the analytics and statistics that the Billy Beane and the Oakland Athletic’s took to replace three key offensive players with an extremly limited budget. I am aware that NBViewer is having issues with the MathJax formulas, but it is the only way currently to publish my plotly plots so please bear with me. Lets get started!